
RabbitMQ Queues- High Availability and Migration

RabbitMQ stores contents of a queue on a single node by default. We can optionally mirror these contents across different nodes.
Each mirrored queue has one master and one or more mirrors. Any operation that takes place on the queue like adding a message, consuming a message etc. happens on the master node first. Since all the messages are replicated across all mirrors and all the operations are also propagated to them, adding mirrors does not reduce the load on the queue. However, it provides us with high availability. In case, the node on which master for your mirror is located goes down, one of the mirrors can take over without impacting the availability of the queue.
We can setup various different mirroring policies to suit our availability requirements. RabbitMQ provides 3 policies out of the box:
  • Exactly: Using this you can specify exact number of replicas(master + mirrors) for the queue in the cluster.
  • All: Queue will be replicated across all nodes on cluster. Use this option carefully as this might put too much network I/O, disk space usage etc. on your cluster due to update propagation across all N nodes.
  • Nodes: Queue is mirrored to nodes listed in the node names parameter.
For a 3 or 5 nodes cluster you should set the replication policy to replicate to majority of nodes, i.e. 2 and 3 respectively.
To equally distribute load among different nodes on your cluster, your queue masters should be equally distributed among all nodes. you should change your queue_master_locator key in the configuration to one of the following values:
  • Pick the node hosting the minimum number of bound masters: min-masters
  • Pick the node the client that declares the queue is connected to: client-local
  • Pick a random node: random
Additionally, you can also specify the master location for a specific queue using x-queue-master-locator queue declare argument.
Even after setting up these policies, you might still end up with unbalanced load across your cluster due to node restarts. In this case, you can migrate masters for some of the queues on a heavily loaded node to a less loaded one. To do this, you can setup a policy with higher precedence then the current mirroring policy using RabbitMQ admin dashboard. For a queue named user-updates, we can define the policy like this:
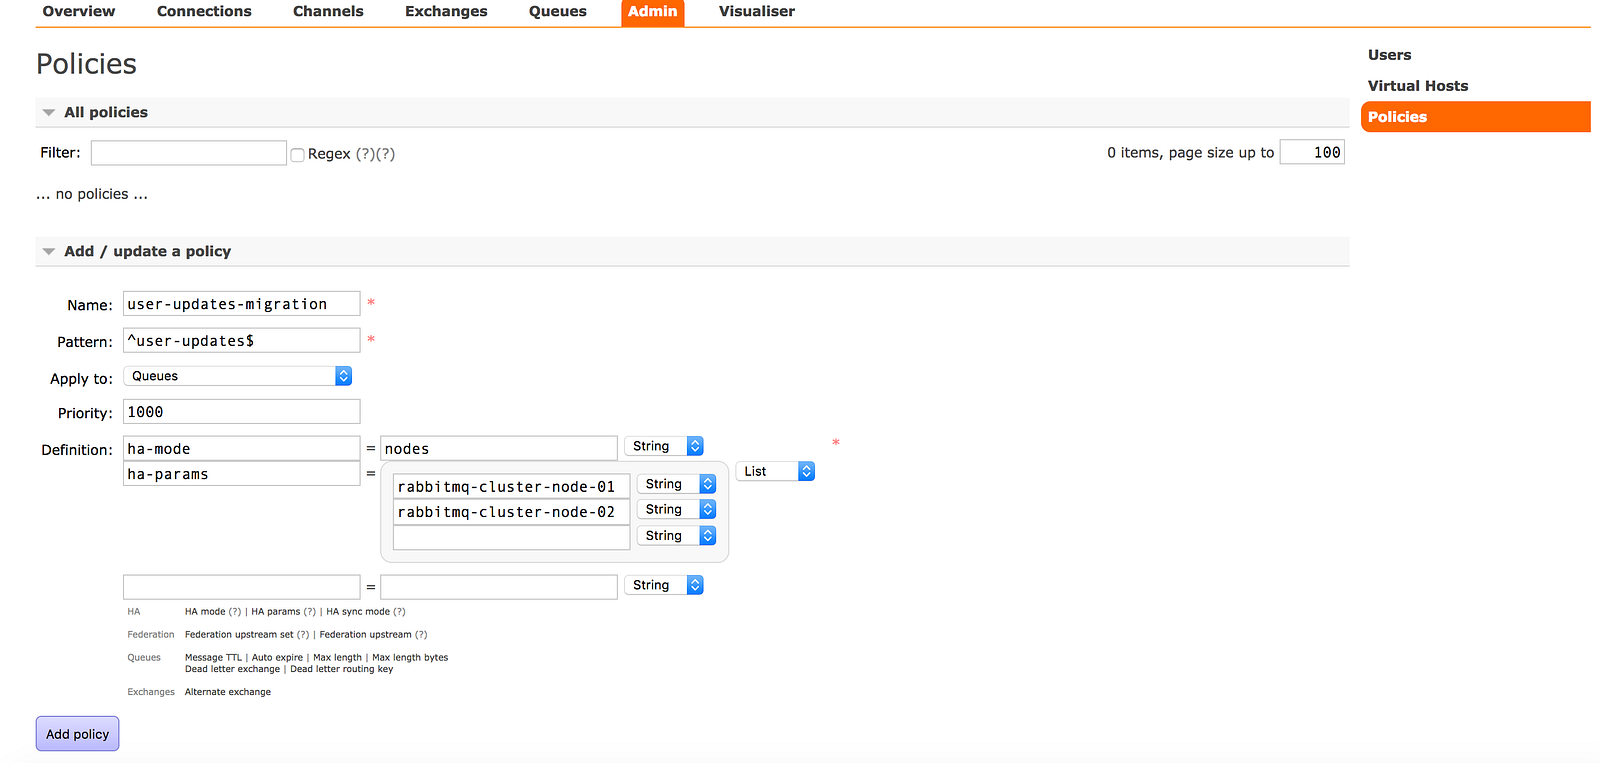
Once you click on add policy, user-updates queue would be migrated to node-01 and node-02 from its current location. However, you have to be careful while doing this. Since, changing the HA policy might cause the master to go away all together if its not listed in new policy, RabbitMQ keeps the existing master node, till at least one of the mirrors has synchronized.
For example, if a queue is on [A B] (with A the master), and you give it a nodes policy telling it to be on [C D], it will initially end up on [A C D]. As soon as the queue synchronizes on its new mirrors [C D], the master on A will shut down.

Comments

Popular posts from this blog

Monitoring Spring Boot API response times with Prometheus

Prometheus is a very useful tool for monitoring web applications. In this blog post, we will see how to use it to monitor Spring Boot API response times. You have to include following dependencies in your build.gradle file: compile group: 'io.prometheus', name: 'simpleclient_hotspot', version: '0.0.26' compile group: 'io.prometheus', name: 'simpleclient_servlet', version: '0.0.26' compile group: 'io.prometheus', name: 'simpleclient', version: '0.0.26' Now you will have to expose a Rest Endpoint, so that Prometheus can collect the metrics by scraping it at regular intervals. To do that, you would have to include these Java configuration classes: @Configuration @ConditionalOnClass(CollectorRegistry.class) public class Config { private static final CollectorRegistry metricRegistry = CollectorRegistry. defaultRegistry ; @Bean ServletRegistrationBean registerPrometheusExporterServlet() { retu...

Redis Pipelines and Transactions with Golang

Redis is an in memory datastore mostly used as a cache. Clients can send commands to server using TCP protocol and get the response back. So, usually a request works like this. Client sends a request to server and waits for the response to be sent back. Server processes the command and writes the response to the socket for client to read. Sometimes, in application flow we have to process multiple keys at once. In this case, for each request there will be a network overhead for the round trip between server and client. We can reduce this network overhead by sending commands to the Redis server in a batched manner and then process all the responses at once. This can be achieved using pipelines as well as transactions. Pipelining in Redis is when you send all the commands to the server at once and receive all the replies in one go. It does not provide any guarantees like no other commands will be processed between your pipelined commands. Transactions in Redis are meant to be ...

Monitoring Go micro services using Prometheus

In this age of web scale architecture, Golang has become the language of choice for many developers to implement high throughput micro services. One of the key components of running and maintaining these services is to be able to measure the performance. Prometheus is a time series based database which has become very popular for monitoring micro services. In this blog, we will see how to implement monitoring for your Go micro service using prometheus. We will be using the official Prometheus library github.com/prometheus/client_golang/prometheus/promhttp to expose the go metrics. You can use Promhttp library’s HTTP handler as the handler function to expose the metrics. package main import ( "github.com/gorilla/mux" "github.com/prometheus/client_golang/prometheus/promhttp" "net/http" ) func main() { router := mux.NewRouter() router.Handle( "/metrics" , promhttp.Handler()) http.ListenAndServe( ":8080" , router ) }...